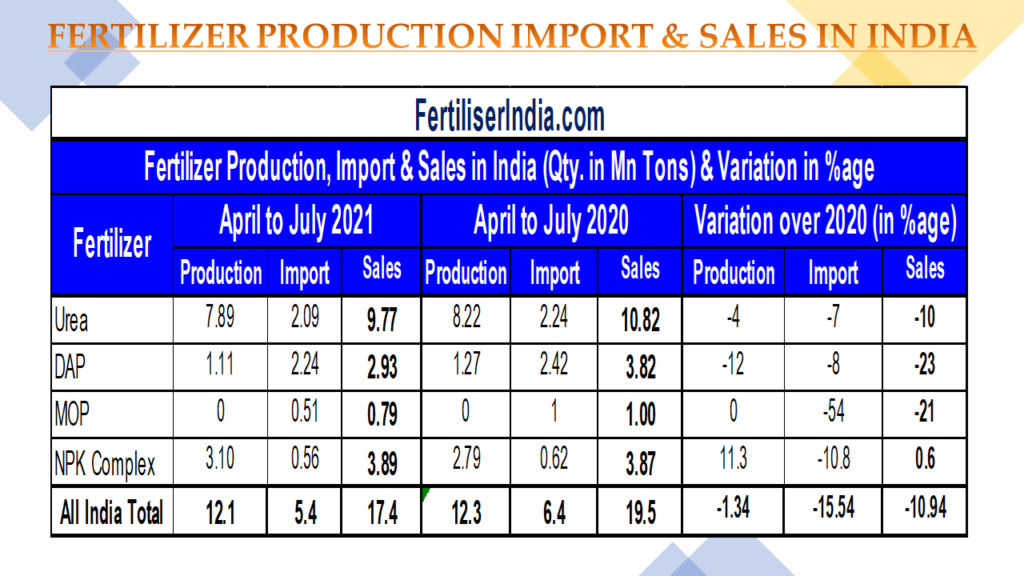
NPK Production during April-July increased by 11%; however, Urea and DAP Production were reduced by 4% and 12% over last year corresponding Period (Apr-July).
Imports of Urea, DAP, MOP and NPK were decreased by 7% , 8% , 54% and 11% respectively over last year corresponding Period (Apr-July).
Sale of Urea, DAP and MOP were decreased by 10%, 23% and 21% over last year corresponding Period (Apr-July), while NPK sales was increased by just 0.6% over last year during same corresponding period.
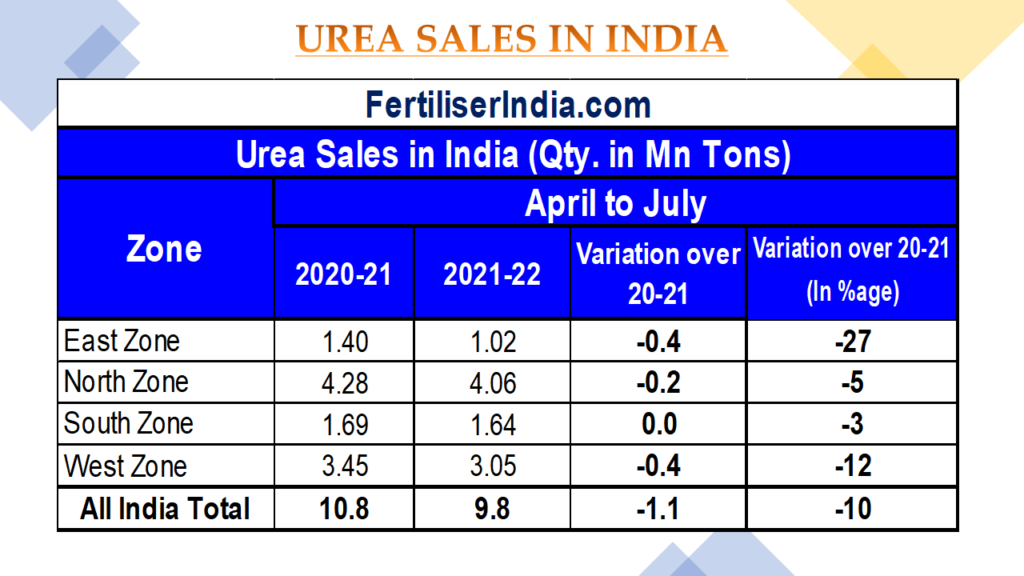
PAN India urea sales deficit by 10% (1.1 million tons). Maximum hit is in east zone which is deficit by 27% (o.4 million tons), followed by west zone by 12%(0.4 million tons).
PAN India DAP sales deficit by 23% (0.9 million tons). Maximum hit is in east zone which is deficit by 30% (o.15 million tons), followed by north zone by 27%(0.26 million tons) and west zone by 26% (0.47 million tons) .

PAN India MOP sales deficit by 21% (0.2 million tons). Maximum hit is in east zone which is deficit by 36% (o.07 million tons), followed by north zone by 30% (0.03 million tons) and south and west zone by 18% (0.06 million tons) and 14% (0.05 million tons).

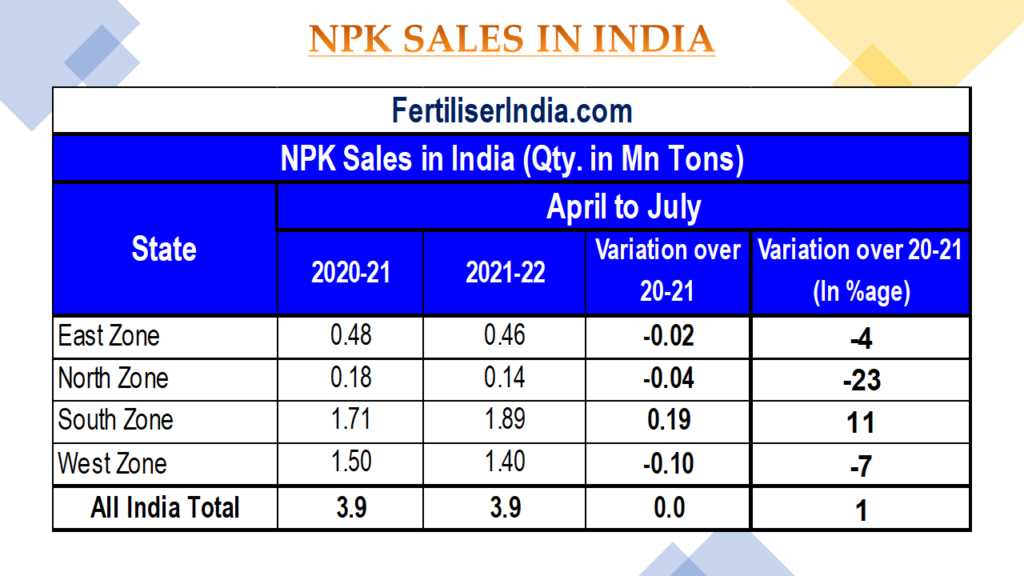
PAN India NPK sales was remain same during corresponding period (April to July ) last year. South zone sales climbed by 11% (0.19 million tons). However deficit is reported in north zone by 23% (0.04 million tons), west zone by 7% (0.1 million tons) and east zone by 4% (0.02 million tons).
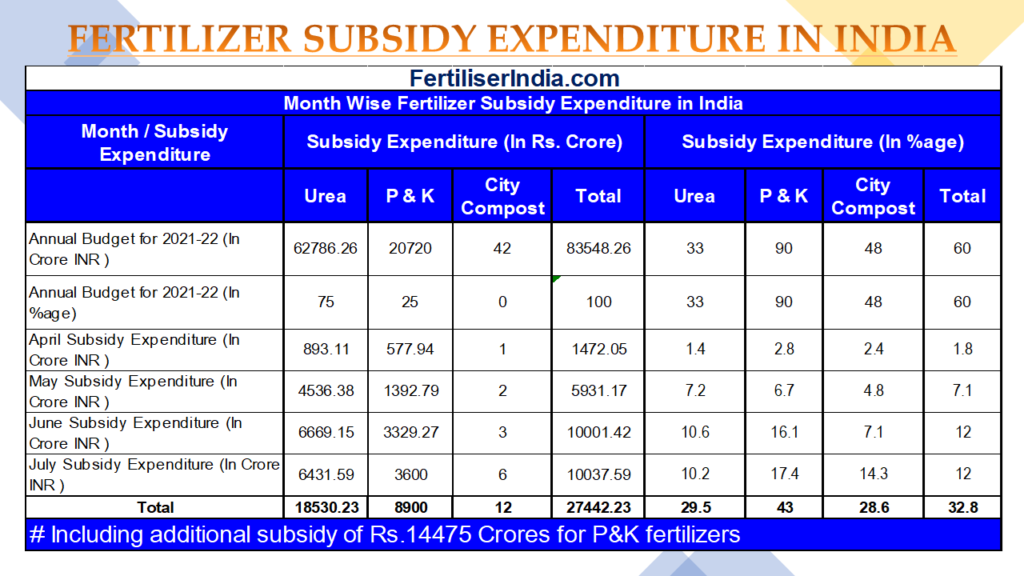
Government of India has fully paid fertilizer subsidy up to July’21.
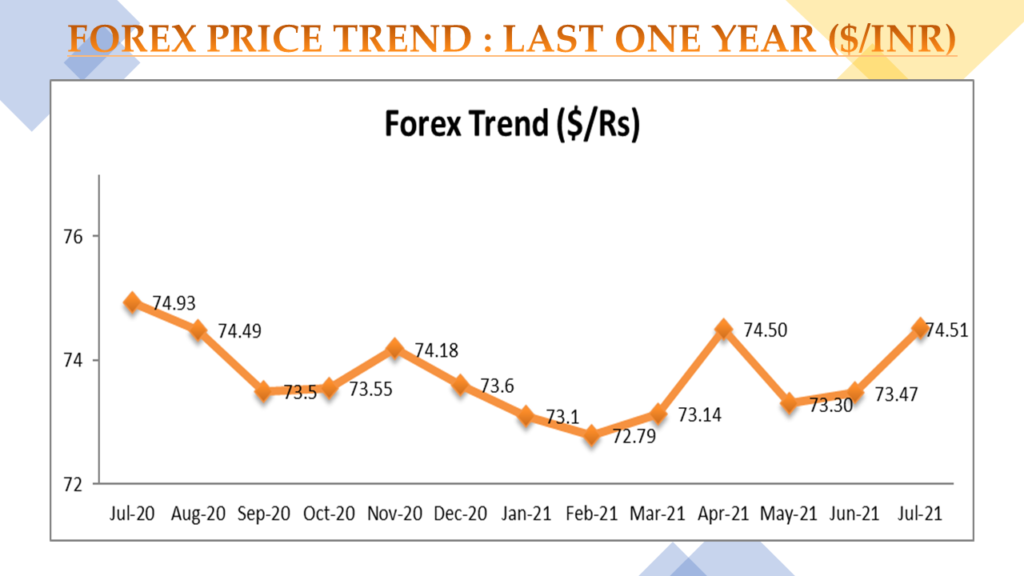
Forex shown upward trend over June’21, however less than July’20.
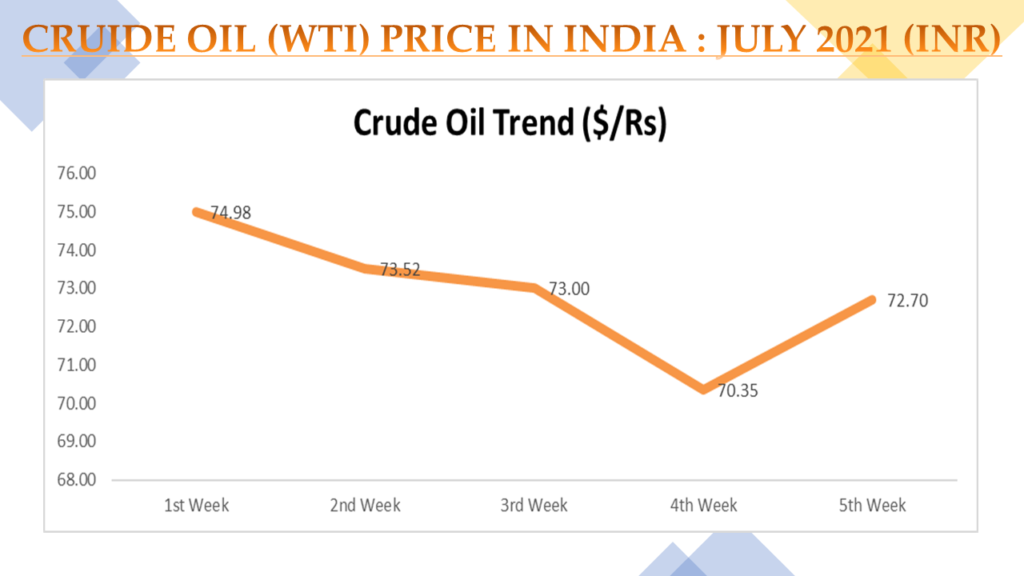
Crude oil (WTI) price in India shown downward trend in first three weeks, however shown upward in last week of July.21
Global Fertilizer Price Update July’ 21
Global fertilizer prices are climbing high every month and touching a new height. Black Sea Urea Price have touched US $ 441.5 per ton in July’ 21, US DAP Spot Price (Gulf) US $ 613 per ton and Henry Hub Natural Gas Price US $ 4.02 per MMBTu, However Morocco Rock Phosphate Price for July’ 21 is US $ 125 per ton and there was no change with June’ 21 prices.
International Urea Monthly Price (Black Sea) July 2021
Black Sea Urea Price for July’ 21 is US $ 441.5 per ton which is 12.27% more than June’ 21 prices of US (Black Sea) $ 393.25 per ton and 106% more than last year during same month (July’ 2020 – US $ 214.4 per ton).

US DAP Monthly Price (Gulf) Update July’ 21
US DAP Spot Price (Gulf) for July’ 21 is US $ 613 per ton which is 1.36% more than June’ 21 prices of US $ 604.75 per ton and 101% more than last year during same month (July’ 20 – US $ 305.1 per ton).

Morocco Rock Phosphate Monthly Price Updates July’21
Morocco Rock Phosphate Price for July’ 21 is US $ 125 per ton and there is no change with June’ 21 prices, however 67% more than last year during same month (July’ 2020 – US $ 75 per ton).

Henry Hub Natural Gas Monthly Price Updates July’21
Henry Hub Natural Gas Price for July’ 21 is US $ 4.02 per MMBTu which is 7.2% more than June’ 21 prices of US $ 3.75 per MMBTu and 131% more than last year during same month (July’ 20 – US $ 1.74 per MMBTu).

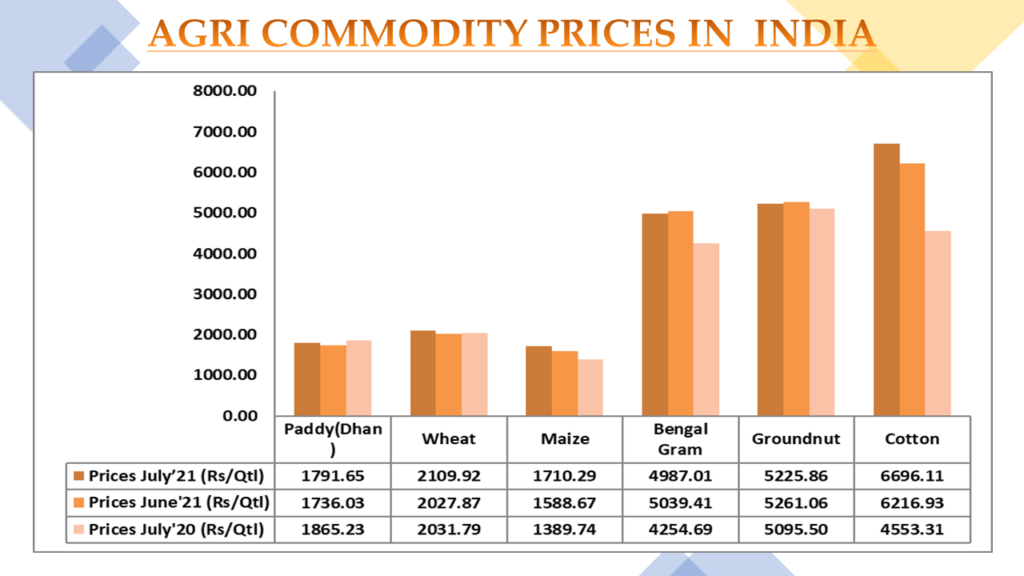
Kharif crop sowing deficit by 42 lakhs ha (4.7%) over last year, as on 30th July in India.
Major shortfall is in cotton by 8.7% (10.5 lakh ha), total coarse cereals by 5.6% (8.3 lakh ha), total oil seeds by 5.5% (9.6 lakh ha), total pulses by 3% (3.3 lakh ha), and paddy by 4% (11 lakh ha).


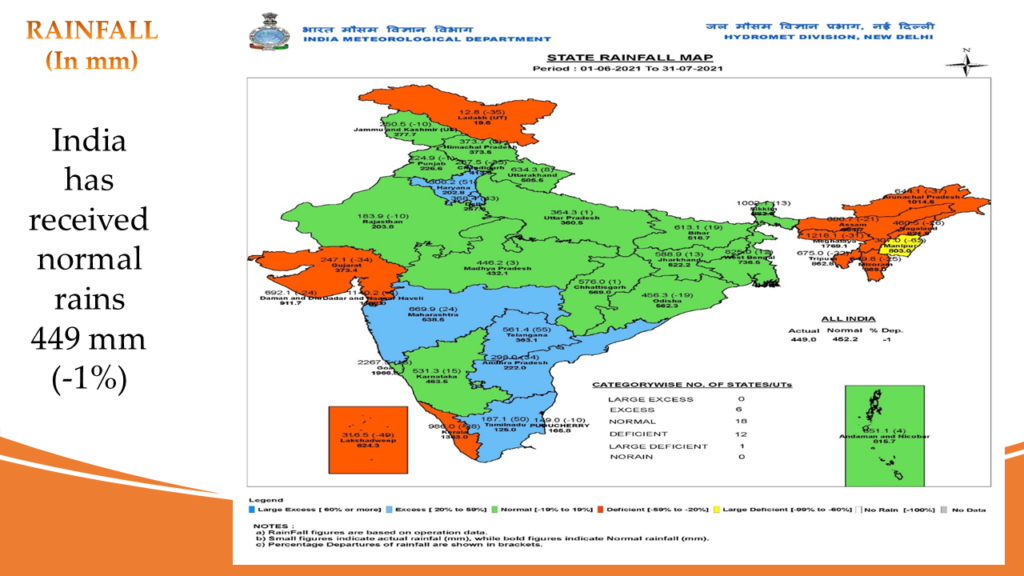
India (-1%) has received normal rains. The live storage available in 130 reservoirs is 121% of the live storage of corresponding period of last year and 121% of storage of average of last ten years.